Ethernet commands
The RBRquartz³ BPR with an MCBH or a MINK external connector may be wired to stream the data via the Ethernet. See the pinout diagrams in the Specifications section and the hardware structure of the instrument, in the block diagram below.
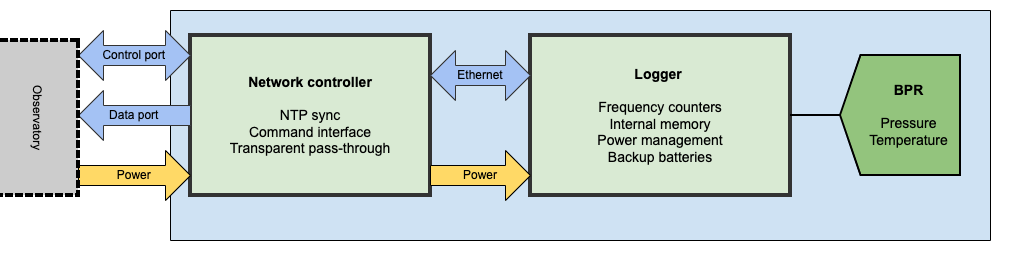
|
You do not need to open your instrument to connect it to your network. Connect your terminal to the MCBH or a MINK external port using a compatible patch cable. The instrument will appear on your network. |
1. IP connections
IP connections to the instrument are made via two different ports.
The first is the data port (23) which is a read-only socket where the client should simply listen for the measured data that is being streamed out. The second is the control port (2323) which permits some settings to be modified.
Upon connection to the control port (2323), there will be no immediate response or banner. You can enter commands by typing them in.
|
When entering a command, terminate with linefeed. Any carriage returns will be ignored. |
2. Performance and timing considerations
-
Logger
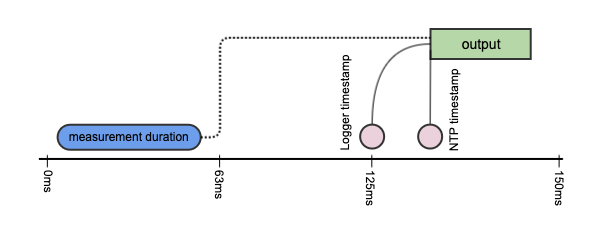
Logger readings will be timestamped no earlier than 63ms and no later than 125ms from when the reading was completed. The resolution of logger timestamps is 63ms. Logger output of the timestamped sample will occur within 63ms of the indicated timestamp.
-
NTP-based tagging
The network controller associates each sample received from the logger with an NTP-based timestamp upon receiving the first character of the line of data from the logger. The resolution of NTP-based timestamps is 5ms. After receiving the entire sample, it is sent to the TCP connection within 5ms.
3. Starting up for the first time
In order to start the logger, use the transparent mode in the control interface and the following commands. These assume that the logger clock has been reset already, if of interest ( clock command).
deployment starttime = 20000101000000, endtime = 20991231235959
sampling mode = continuous, period = 63
enable erasememory = true
4. Configuring network settings
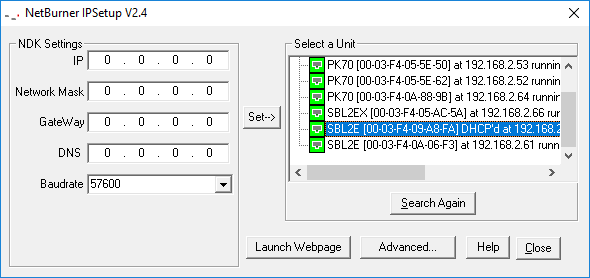
To configure the network controller, download the Windows-only executable IPSetup binary required to run on a host on the same subnet (same UDP broadcast domain) as the instrument.
In its default state, the instrument will attempt to acquire network configuration information via DHCP. Using IPSetup, configure the static IP address, network mask, gateway, and DNS server of the instrument. No other settings in IPSetup should be changed at risk of an invalid configuration requiring the instrument to be returned to RBR for service.
5. Periodic stop-erase-start procedure
disable
enable erasememory = true
As the instrument has a linear memory, in order to provide protection for a possible network outage it is important to periodically stop the logging, erase the memory, and restart. This process should take less than ten seconds, during which there will be no streaming data, nor logged data. As the logger memory will fill in ~25 days, this process should be followed every 20 days (or 3 weeks) to give some margin for human error.
6. Procedure after an observatory outage
<download while still running - may take hours or days>
// chunksize := 500
// offsetdataread := 0
>> meminfo
<< meminfo used = YYY
// totalsize := YYY
// while (offsetdataread < totalsize) {
// while (offsetdataread < totalsize) {
>> readdata dataset = 1, size = chunksize, offset = offsetdataread
<< readdata dataset = 1, size = nbytesread, offset = 2000 offsetread<cr><lf><bytes[0…nbbytesread]-of-data><crc>
// if crc ok
// {
// append bytes read to output file
// offsetdataread := offsetdataread + nbbytesread
// }
// }
>> meminfo
<< meminfo used = YYY
// totalsize := YYY
// }
<end of download>
>> disable
>> enable erasememory=true
The download can be performed by reading all the bytes in dataset 1 and writing them in a *.bin file. Ruskin is able to read directly those files.
For more details on the read and meminfo commands and the CRC calculation, please refer to the L3 command reference.
7. Stopping the instruments and preparing for shipment
disableThe only command required to be sent to the logger (using the transparent mode in the control interface) is disable. The control interface will still be active but may be powered down by removing the patch cable. The internal batteries will continue to provide backup power to the logger RTC (~10uA) and will last for many years in this state.
8. Control port commands
Upon connection to the control port (2323), there will be no immediate response nor banner. If the command required is known, it can be entered immediately (all commands are terminated with line-feed, and any carriage returns are ignored). If the commands are not known, the question mark ("?") command can be used to display the network controller control menu.
The control port connection supports a single connection. It is important that the connection is closed after use, permitting others to establish connections if necessary.
------ RBRquartz3 BPR NETWORK INTERFACE CONTROL MENU ------

 D: Display current settings
 S: Set NTP source
 R: Set NTP refresh rate
 J: Set the timestamp jump tolerance
 E: Set the transparent mode inactivity timeout
 T: Enter transparent mode
 !: Exit transparent mode (once in transparent mode)
 Q: Close this connection
 #: Reset the RBRquartz3 BPR network interface
?: Print this menu-
D: Display current settings
RBRquartz3 BPR Network Interface v1.5.1
Uptime: 0 days 00:13:03.340
Current time: 2021-05-10 15:11:48.248
System parameters
-----------------
NTP time sync rate (min):                 1
NTP source:                               NTP pool
Timestamp jump tolerance (s):             1800
Transparent mode inactivity timeout (s):  10
Last valid time sync:                     2021-05-10 15:11:02.934
The current settings shown include:
-
Uptime: approximate time since the last reboot - either due to power up or the
#reset command. -
Current time: this clock is maintained according to the NTP settings.
-
NTP time sync rate: frequency at which the NTP source is polled to correct for clock drift. See
Rcommand. -
NTP source: Either the IP address of the NTP server or the phrase “NTP pool”. See the
Scommand. -
Timestamp jump tolerance: time tolerance in seconds for the difference in the logger clock between two subsequent samples. (Only when the new sample is in the future)
-
Transparent mode inactivity timeout: timeout for leaving transparent mode if no input is received in the set amount of time.
-
Last valid time sync: the last time at which a successful poll of the NTP source occurred.
-
S: Set NTP source
Enter NTP source (IP address, a.b.c.d).
To use pool.ntp.org, enter 0.
By default, the NTP Pool will be used as the source of NTP times. A custom NTP server can be used by providing its IP address.
Whenever this value is changed, an NTP poll is performed immediately and the schedule for polling is restarted.
-
R: Set NTP refresh rate
Enter the NTP refresh rate (number of minutes, 1-60; default: 1):The frequency with which time is polled from the NTP source can be adjusted.
Whenever this value is changed, an NTP poll is performed immediately and the schedule for polling is restarted.
-
J: Set the timestamp jump tolerance
Enter the timestamp jump tolerance (number of seconds, 1-86400; default: 1800):The time tolerance between two subsequent instrument samples to trigger a clock sync with the logger. This will accommodate cases where the logger is reconfigured externally.
-
E: Set the transparent mode inactivity timeout
Enter the transparent mode inactivity timeout (number of seconds, 10-60; default: 10):The time for exiting transparent mode automatically if no commands are issued in that time frame.
-
T: Enter transparent mode
Data streaming off
Transparent mode on
To communicate with the instrument directly, use the T command to enter transparent mode. Upon entering transparent mode, the instrument’s streaming output will be automatically disabled. While in transparent mode no output will be sent to the data client; however, any connections to the data port will remain open and will resume receiving data when transparent mode is closed. Upon leaving transparent mode, the streaming output of the instrument will be automatically re-enabled (providing that the instrument is enabled).
There are two ways of leaving transparent mode: manually escaping with the ! character (described below), and an automatic configurable idle timeout. If 10 seconds, or the set time, elapse without characters being received by the network controller, transparent mode will automatically be closed and streaming output will be restarted.
Transparent mode is maintained across multiple control client connections. If the control client is disconnected without escaping from transparent mode (i.e., by abruptly terminating the socket connection), future connections will be placed directly into transparent mode (unless the idle timeout has been exceeded).
-
!: Exit transparent mode (once in transparent mode)
Data streaming on
Transparent mode off
When in transparent mode, send a ! character to immediately leave the mode and restart instrument streaming.
See the notes for the T command for details on the behaviour of the data port upon leaving transparent mode.
-
Q: Close this connection
Connection closed by foreign host.Explicitly close the connection to the control port.
-
#: Reset the RBRquartz³ BPR network controller
Resetting server. All connections will be lost!
Connection closed by foreign host.
The control interface is reset by this command, a process that takes <10s. All network connections are lost and will have to be re-established. The network controller clock is reset to the beginning of 1970, but the first NTP sync should be done by the time the first connection is made.
-
?: Print this menu
Displays the menu as shown above.
8. Data port format
The data port provides read-only data and does not respond to any commands.
9. Sample data
The format of the data is as follows:
| # | Name | Format | Notes |
|---|---|---|---|
1 |
Logger time NTP offset corrected |
YYYY-MM-DD HH:MM:SS.sss format. |
The time that the internal logger reports corrected with the latest NTP offset. The current NTP time may be examined using the |
2 |
Logger time |
YYYY-MM-DD HH:MM:SS.sss format. |
The time that the internal logger reports. This clock may be read and set using the |
3 |
BPR temperature (C) |
Double precision (64 bit) floating-point number. |
The temperature derived from the BPR. |
4 |
BPR pressure (dbar) |
Double precision (64 bit) floating-point number. |
The pressure derived from the BPR. |
5 |
BPR pressure period (ps) |
Double precision (64 bit) floating-point number. |
The period of the pressure channel of the BPR. |
6 |
BPR temperature period (ps) |
Double precision (64 bit) floating-point number. |
The period of the temperature channel of the BPR. |
2021-05-06 19:03:37.924, 2021-05-06 15:03:37.000, 26.141700000, 9.235400000, 30284722.000000000, 5752694.000000000One variation to the normal data format will occur when an internal error occurs. This error usually happens on a single channel at a time, and is most often caused by a failed electrical connection so that no valid readings are available. If this occurs, it will look like the following sensor error example:
2021-05-06 19:03:39.924, 2021-05-06 15:03:39.000, Error-9, 9.232900000, 30284722.000000000, 5752694.000000000All errors should be reported to RBR for investigation.
10. Events
-
All events obey the following format:
#EVENT_NAME, timestamp, eventPayload1, eventPayload2, ..., eventPayloadn- 1, eventPayloadnEVENT_NAME is a string name for the event
timestamp is the time at which the event occurred; depending on the event type, this may correspond to a corrected sample time
eventPayload1 … eventPayloadn are the payload values for the event
-
NTP synchronization events
When an NTP synchronization occurs, one #NTPSYNC event will be generated on the output:
2021-05-06 19:03:38.924, 2021-05-06 15:03:38.000, 26.141700000, 9.235400000, 30284722.000000000, 5752694.000000000
#NTPSYNC, 2021-05-06 19:03:39.924, 2021-05-06 15:03:39.000, 924
2021-05-06 19:03:39.924, 2021-05-06 15:03:39.000, 26.141700000, 9.235400000, 30284722.000000000, 5752694.000000000
#NTPSYNC corresponds to an NTP offset adjustment
Its timestamp is the logger time for the sample on which synchronization occurred corrected with the new NTP offset
eventPayload1 is the logger time for the sample on which synchronization occurred
eventPayload2 is the new NTP offset in milliseconds