RSKplotburstdata.m
Arguments
Input
-Required-
RSK
-Optional-
channel: longName.
Output
handles
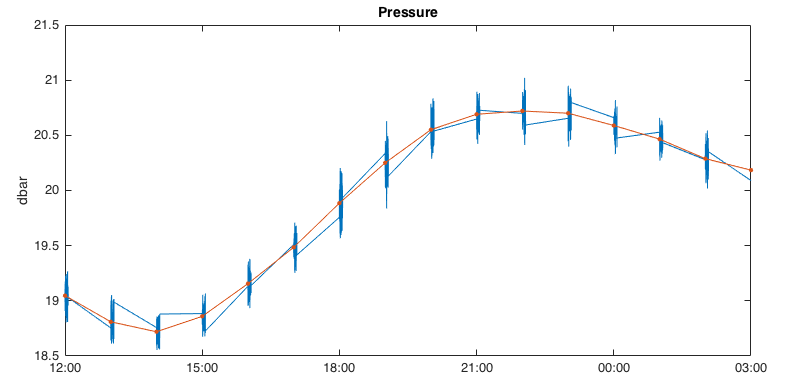
This function plots the burstData initially read by RSKreadburstdata.m.
It creates a subplot for every channel available, unless the channel argument is used to select a subset.
The code below created the plot below it.
rsk = RSKopen(filename);
rsk = RSKreaddata(rsk, 't2', datenum(2016,05,13,12,00,00));
rsk = RSKreadburstdata(rsk, 't2', datenum(2016,05,13,12,00,00));
hdlsburst = RSKplotburstdata(rsk, 'channel','Pressure');
hold on
hdlsdata = RSKplotdata(rsk, 'channel','Pressure');
hdlsdata.Marker = '.';
hdlsdata.MarkerSize = 10;
|
|---|
In the figure above, the blue line is the values in the burstdata field and the orange dots are the values in the data field. |