Wave overview
The RBR tide and wave recorder is a high-precision fast-sampling pressure sensor. It is available with a range of thermally-compensated pressure transducers, which are selected to best suit your deployment depth. The function of the instrument is to transform the pressure of the water above it to depth so that the RBR Software, Ruskin can then derive parameters to characterize tides and waves over the deployment (2).
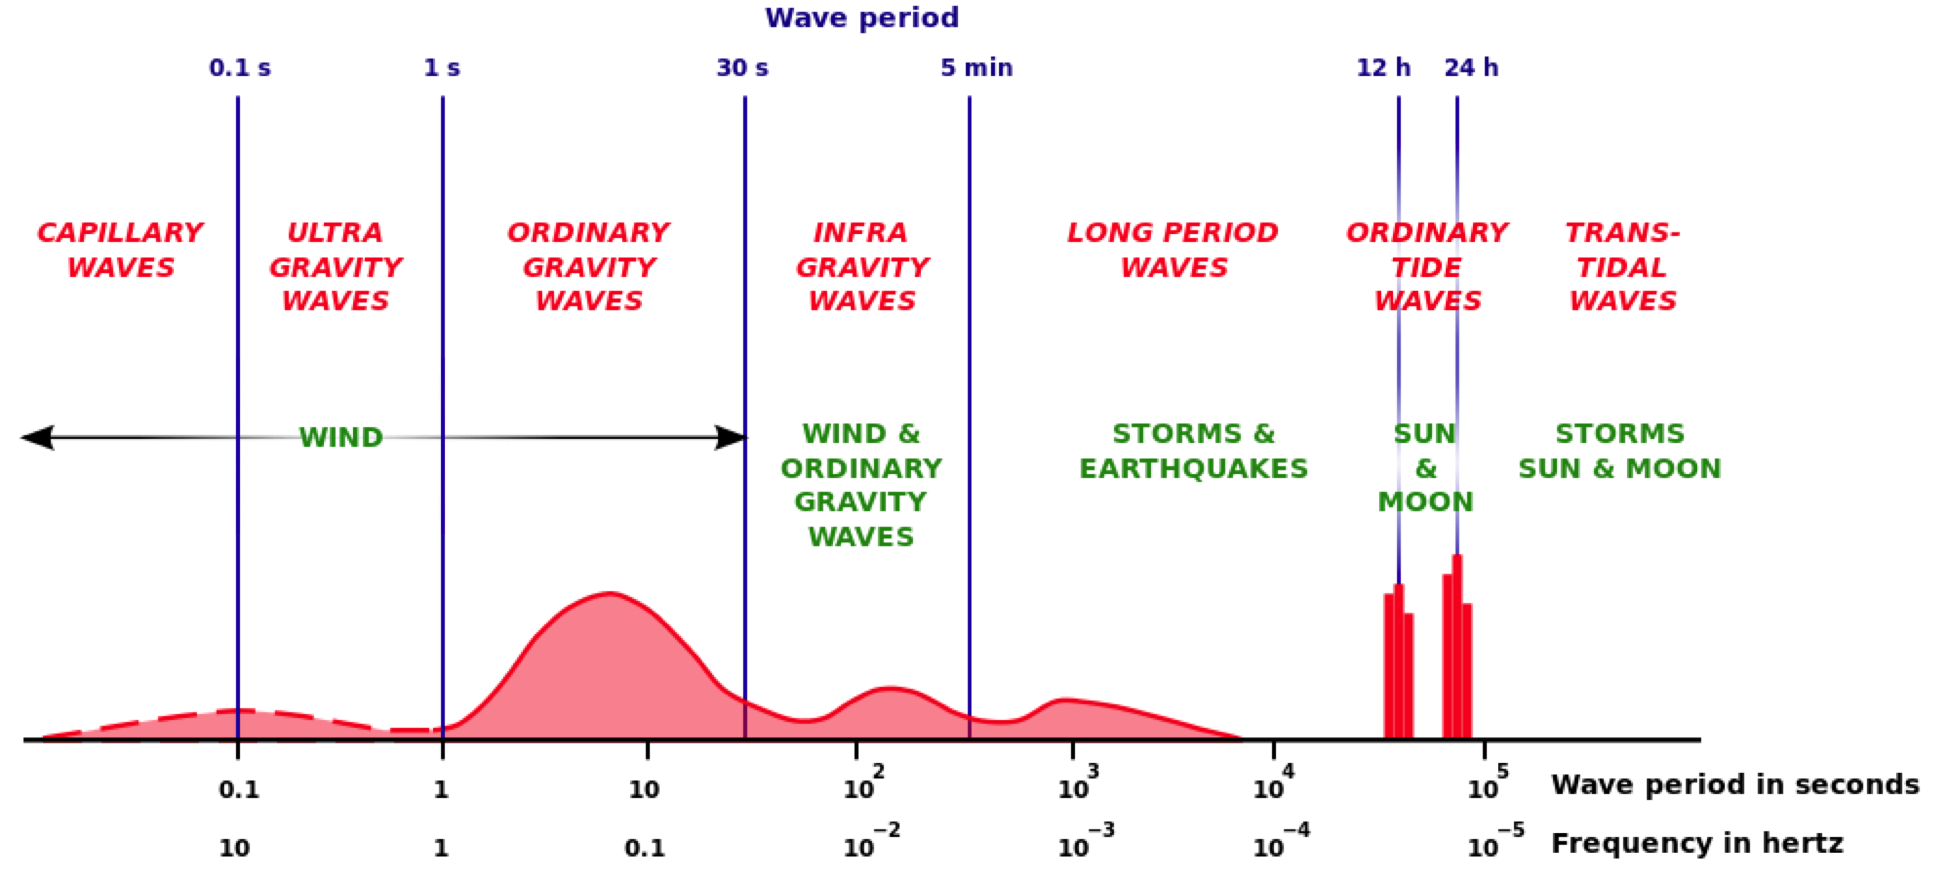
Tides are represented as long-term changes in the depth of the logger whereas waves are represented as high-frequency changes. The spectrum of ocean surface waves varies substantially in energy as well as in frequency. Below shows this spectrum of tidal frequency and energy. Scientists and engineers are interested in monitoring the local effect of waves as they contribute to the transport of sediments and erosion patterns. Tide periods are influenced by both the sun and the moon and are at 12 & 24hrs, whereas waves, which are typically <30 seconds, are primarily driven by wind. The total energy found across the wave spectrum is primarily divided into these two groups of low-frequency waves (tides) and high-frequency gravity waves.

Figure 1. The spectrum of tidal frequency and energy.
Tidal slope
The tide recorder detects the tidal low-frequency variations of depth by applying averaging to remove the high-frequency variation induced by waves. The instrument can sample up to 16Hz during the burst period and output the averaged value for a filtered tide record. Ruskin derives tidal slope from this data which can be used to give a more detailed depiction of the tidal profile.
Waves
Waves are represented as high-frequency changes in the depth measurements. The instrument can be deployed to take samples of the waves at regular intervals. The instrument collects a burst of data of 512 to 32768 samples at rates up to 16Hz, where both the number of samples and the sampling rate can be programmed independently. Together the rate, sample number, and depth define the shortest and longest wave that the logger can detect (2). To determine the appropriate burst length, a useful criterion is to have 100 samples times the period of the longest wave, ie. 512 samples to resolve up to a 5-second wave. For the minimum period that can be resolved, it is a function of sample rate and depth. Attenuation of the wave through the water column restricts the smallest wave the logger can resolve and Ruskin uses a cutoff criterion for determining this based on the accuracy of the pressure transducer. When setting up the deployment in Ruskin, the depth and altitude are inputted, and the resulting wave frequency that can be resolved is estimated and displayed. After recovering the recorded time sequence of wave data, Ruskin applies linear wave theory analysis to reconstruct the surface wave and produce the parameters below. Statistics for these values are calculated by determining negative-to-positive zero crossings, as well as ignoring the first and last partial waves.
References:
(1) Earle, M. D. Nondirectional and Directional Wave Data Analysis Procedures; NDBC Technical Document 96-01, Slidell, Louisiana; 1996.
(2) Gibbons, D. T., G. Jones, E. Siegel, A. Hay, and F. Johnson (2005), Performance of a new submersible Tide-Wave recorder, Oceans, 2005. Proceedings of MTS/IEEE, vol. 2, pp. 1057–1060, IEEE, New York, doi:10.1109/OCEANS.2005.1639895.
(3) Mobley, C. Wave Energy http://www.oceanopticsbook.info/view/surfaces/level_2/wave_variance_spectra__theory (accessed Apr 21, 2017).
