RSKimages.m
Input
-Required-
RSK
-Optional-
channel: longName of channel to plot, default is all channels.profile: [ ] (default is all profiles).direction: up or down (default).reference: y-axis variable. Can be any other channel. Default is sea pressure.showgap: plotting with interpolated profiles onto a regular time grid, so that gaps between each profile can be shown when set as true. Default is false.threshold: time threshold in seconds to determine the maximum length of gap shown on the plot. Gaps smaller than threshold will not show.
Output
- handles : Image handles object
RSK: RSK structure withRSK.imfield containing data for 2D visualization
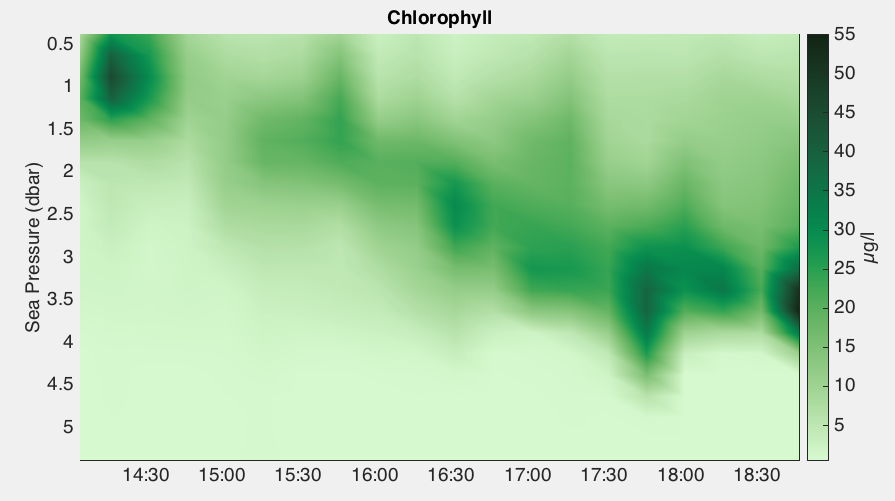
This function produces a heat map of any specified channel. The x-axis is always time, the y-axis is the reference channel argument, which is commonly depth or sea pressure, but can be any channel (default is Sea Pressure). Each profile must be gridded onto the same reference channel, which is accomplished with RSKbinaverage.m.
Example:
handles = RSKimages(rsk, 'channel', 'chlorophyll', 'direction', 'up');
|
|---|
The |
Users can customize the length of the time gaps over which the data are interpolated with the threshold input parameter. RSKimages calls RSKgenerate2D to generate data for visualization and store it in RSK.im field. RSK.im contains x, y and data field for the users' convenience to render the plot as they like.
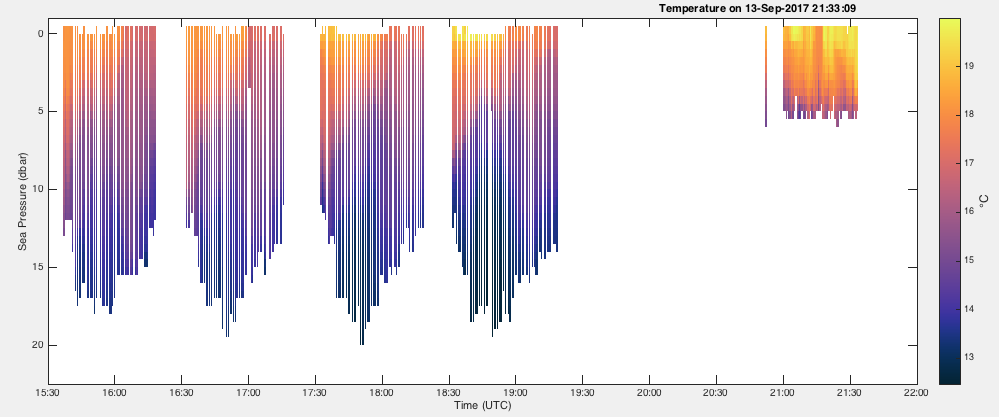
Below are two examples of how to use the showgap parameter.
To plot the data with the gaps intact:
handles = RSKimages(rsk,'channel','temperature','direction','down','showgap',true);
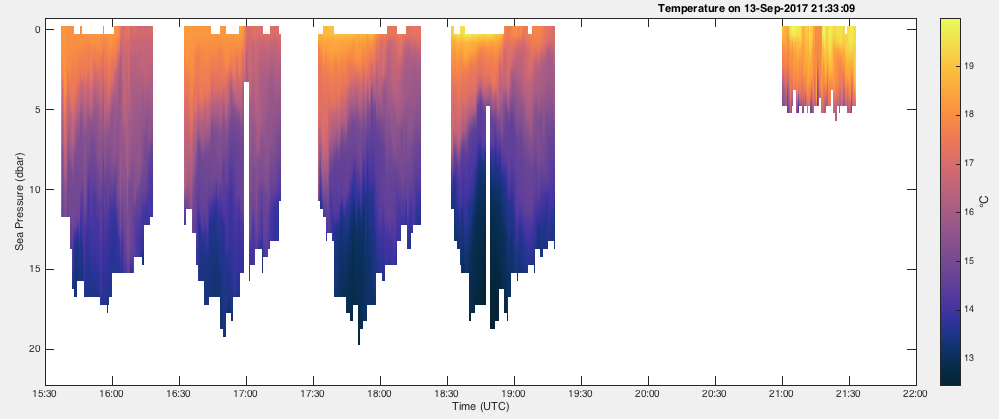
To fill all of the gaps longer than 6 minutes with interpolated values:
handles = RSKimages(rsk,'channel','temperature','direction','down','showgap',true,'threshold',360);
The function calls RSKgenerate2D for data processing, the generated 2D data is stored in RSK.im.