RSKplotdata.m
Arguments
Input
-Required-
RSK
-Optional-
channel: name of channel(s) to plot. Default is to plot all channels.profile: 1 (default).direction: up or down. Default to the first cast (i.e. the first string in RSK.profiles).showcast: true or false (default) to show cast detection events. It is recommended to show the cast direction patch for time series data only.
Output
- handles
- axes
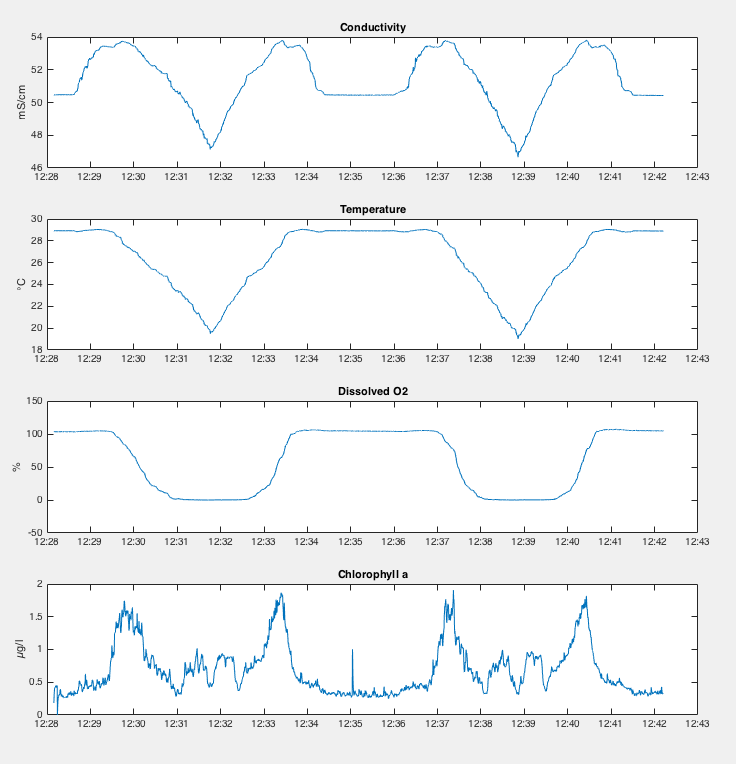
RSKplotdata plots the channels specified by channel as a time series. If a channel is not specified, then RSKplotdata will plot them all. If the data has been organized into profiles with RSKreadprofiles, then users may specify a single profile and direction to plot. In this case, however, RSKplotdata can only plot one cast and direction at a time. If you want to compare many profiles, then either use RSKplotprofiles.m or use "hold on" and rerun the function.
The output handles and axes are vectors of chart line objects and axes which contain the properties of each subplot.
The command below creates the plot below it:
handles = RSKplotdata(rsk, 'channel', {'Conductivity', 'Temperature', 'Dissolved O2', 'Chlorophyll a'})
|
|---|
The figure above is the output of RSKplotdata a subplot is created for each channel is the channels field. |
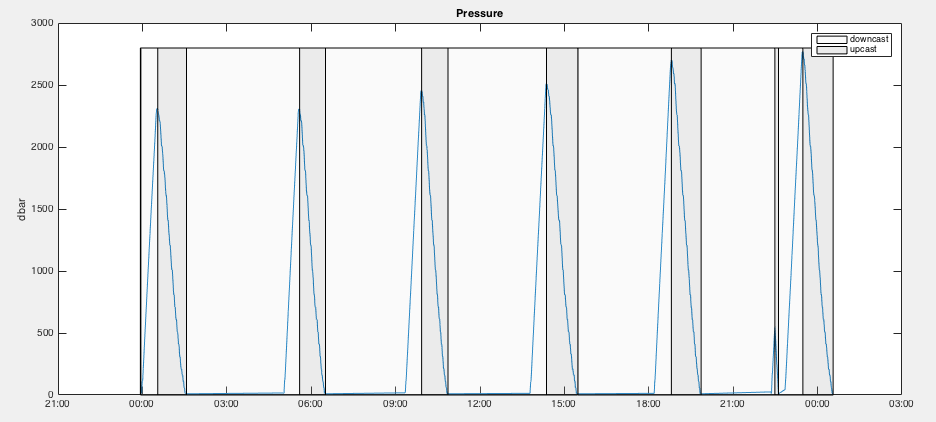
RSKplotdata has an option to overlay cast detection events on top the pressure time series. This is particularly useful to ensure that the profile detection events correctly demarcate the profiles.
The command below plots a time series of pressure with cast detection events overlaid:
handles = RSKplotdata(rsk, 'channel', 'Pressure','showcast',true)
|
|---|
The figure above is the output of RSKplotdata when showcast option is on with pressure channel. |


